Mixpanel and the Continuous Innovation Loop
The Observe → Analyze → Decide → Act (OADA) loop is the framework behind how great teams use Mixpanel to continuously innovate.
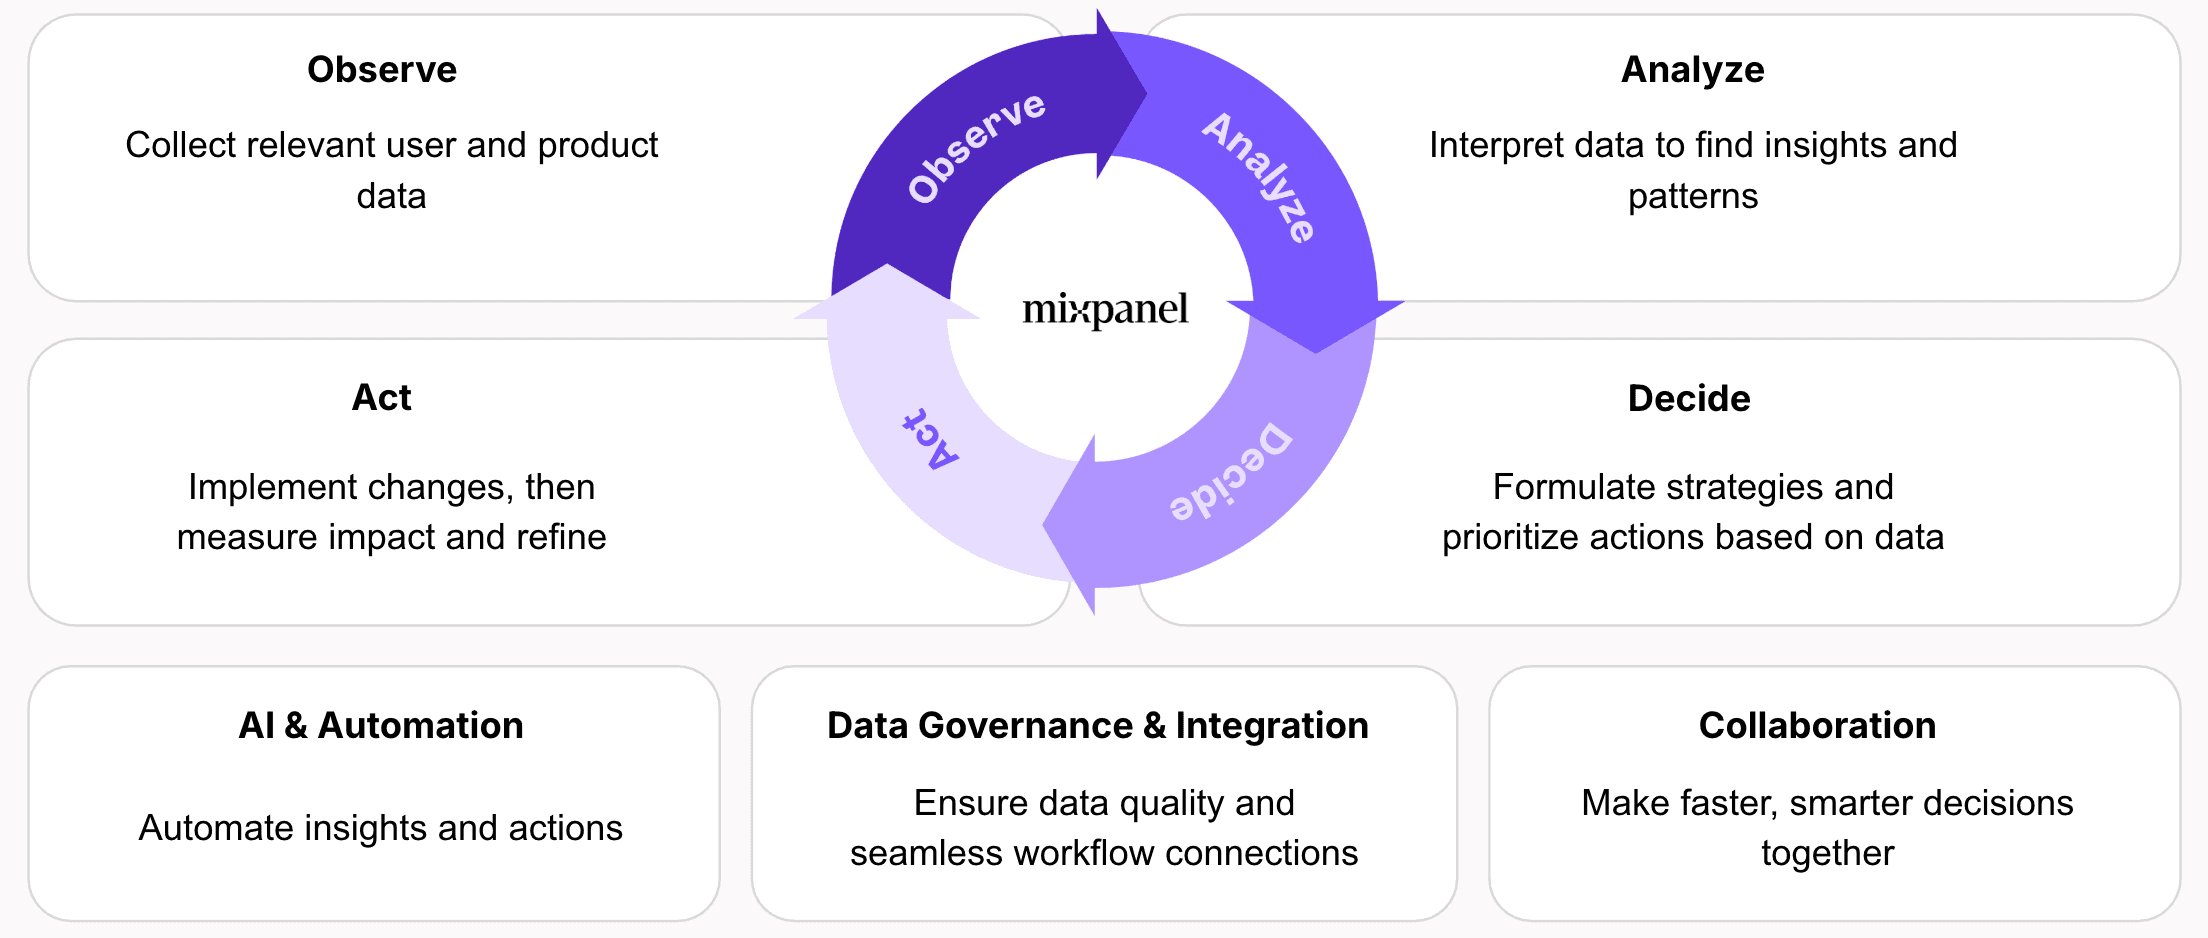
This loop represents the cycle teams follow to turn data into action by first observing what users do, then analyzing why it happens, deciding what to do next, and finally acting on those insights to drive better outcomes.
Each phase represents a key moment in the product decision cycle–—and Mixpanel provides the tools to complete that loop faster with every iteration.
Why it matters: Teams that move through the loop quickly learn what’s working, align faster, and deliver more impactful product improvements.
Why Continuous Innovation Matters
Building great products isn’t just about speed—–it’s about learning continuously.
Markets shift, user expectations evolve, and what worked last quarter might not work tomorrow. The teams that win are the ones that turn data into a habit of improvement by observing what users do, analyzing why it happens, deciding what to do next, and acting with confidence.
Teams that move through the OADA loop quickly:
- Learn what’s working and what’s not
- Align on priorities faster
- Deliver more impactful product improvements with each iteration
Pro tip: Make closing the loop part of every sprint–—observe, analyze, decide, act.
Digital innovation isn’t a one-time project. It’s a continuous cycle of learning and improvement.
How Different Industries Use the Continuous Loop
Mixpanel powers the OADA loop across every industry—helping teams turn data into confident action.
Whether you’re optimizing user onboarding, increasing checkout conversions, or improving content engagement, the same continuous loop applies.
Below are examples of how teams in different industries use Mixpanel to measure, learn, and grow faster.
💼 SaaS: Improving Onboarding and Activation
A SaaS team observes where new users drop off during onboarding, analyzes key behaviors to uncover friction points, decides which improvements will reduce time-to-value, and acts by testing guided experiences that drive activation and retention.
Observe
The team monitors early-user activity using Session Replay, Heatmaps, and Autocapture to see how new users interact with the onboarding flow: Account Created → Tutorial Completed → Key Action Taken. They set up Alerts to track sudden drops in completion.
Analyze
Using Funnels, Flows, and Cohorts, the team identifies where users are stalling and compares completion across personas. Behavioral trends show that users who skip the advanced configuration step activate faster.
| Tool | Observation | Insight |
|---|---|---|
| Funnels & Flows | 45% drop-off between “Account Created” and “Tutorial Completed” | Users struggle with early onboarding complexity. |
| Cohorts | Different activation rates by persona | Simpler onboarding correlates with higher early success. |
| Session Replay | Confusion at advanced setup screens | Users hesitate when asked to complete optional steps too soon. |
Decide
The team uses Metric Trees to understand which metrics—like “First Value Reached”—drive long-term retention. They decide to move optional setup later in the journey and emphasize the first “aha” moment sooner.
Act
They test this change through Experiments, rolling out a new guided flow to a subset of users. When the experiment shows faster activation and higher retention, they launch it to all users using Feature Flags.
✨ Result: Activation improves 15%, and new users reach value faster with fewer drop-offs.
🛍️ eCommerce: Increasing Checkout Conversion
An eCommerce team observes shopper behavior throughout checkout, analyzes patterns to uncover mobile friction, decides which optimizations will improve conversion, and acts by testing streamlined checkout designs.
Observe
Using Session Replay, Heatmaps, and Autocapture, the team tracks the path from Product Viewed → Added to Cart → Checkout Started → Purchase Completed to see where users abandon the flow.
Analyze
Through Funnels, Cohorts, and Retention, the team identifies a 40% drop-off at payment on mobile devices.
| Tool | Observation | Insight |
|---|---|---|
| Funnels | 40% mobile drop-off at payment | Checkout fields are too dense for mobile screens. |
| Session Replay & Heatmaps | Users zoom and misclick on payment fields | UI not optimized for mobile input. |
Decide
The team leverages Metric Trees to link checkout completion to revenue impact. They decide to simplify payment forms and surface the most-used payment options first.
Act
They deploy a Feature Flag to release the redesigned checkout to 50% of traffic and use Experiments to confirm conversion improvements before rolling it out universally.
✨ Result: Checkout completion rises 20%, and mobile shoppers complete purchases faster with fewer errors.
🎬 Media & Entertainment: Boosting Viewer Retention
A streaming platform observes viewer engagement across content, analyzes which experiences retain audiences, decides how to personalize recommendations, and acts by iterating on what drives continued watching.
Observe
The team uses Session Replay, Autocapture, and Alerts to track Episode Started → Episode Completed → Next Episode Started events, identifying drop-offs by series and genre.
Analyze
They turn to Retention and Cohorts to learn which viewers come back. Funnels & Flows show most viewers stop after Episode 2, and qualitative data confirms weak recommendations at that point.
| Tool | Observation | Insight |
|---|---|---|
| Retention & Cohorts | Only 30% return for Episode 3 | Low content continuity beyond early episodes. |
| Funnels & Flows | Drop-off after Episode 2 | Weak recommendations between episodes. |
Decide
Using Metric Trees, the team connects “Episode Completion Rate” to “Viewer Retention.” They decide to insert a personalized “Up Next” prompt and ratings flow to strengthen recommendations.
Act
They run an Experiment on the “Up Next” prompt. After positive results that indicate viewers who see the new recommendations have longer sessions and higher continuation rates, they expand rollout to all viewers using Feature Flags.
✨ Result: Viewer retention improves 25%, with stronger engagement across new series launches.
💰 Fintech: Increasing Feature Adoption and Retention
A fintech product team observes user engagement with budgeting tools, analyzes setup friction, decides how to improve adoption, and acts by optimizing flows that drive retention.
Observe
They track customer actions with Session Replay and Autocapture, focusing on Account Linked → Budget Created → Spending Reviewed → Budget Adjusted. Alerts notify them of sudden drops in budget creation.
Analyze
Using Funnels, Cohorts, and Retention, they find that users linking smaller financial institutions often fail to complete setup.
| Tool | Observation | Insight |
|---|---|---|
| Funnels & Cohorts | Users stop after linking a bank account | Authentication errors block progress. |
| Retention Reports | Users who finish setup return 2× more often | Early success predicts long-term retention. |
Decide
The team uses Metric Trees to link budgeting feature adoption to retention KPIs. They decide to improve error handling and prompt users to set alerts immediately after creating a budget.
Act
They run an Experiment on a new “Set Alert” flow. After positive results, they expand rollout to all customers using Feature Flags.
✨ Result: Budget feature adoption increases 30%, and retention rises 15% as users set up alerts sooner.
🎮 Gaming: Driving Player Engagement and In-App Purchases
A gaming studio observes player behavior across levels, analyzes progression data to uncover friction, decides what changes will improve engagement, and acts by launching prompts that drive completion and purchases.
Observe
The team uses Session Replay, Heatmaps, and Autocapture to track Level Started → Level Completed → In-App Purchase Made, identifying the points where players churn.
Analyze
They turn to Funnels and Cohorts on player feedback to understand why drop-offs occur. Players who use “Power-Ups” progress faster, and replays show many ignore in-game hint icons.
| Tool | Observation | Insight |
|---|---|---|
| Funnels & Cohorts | High player drop-off after Level 3 | Repeated failures at one level lead to early churn. |
| Session Replay & Heatmaps | Players miss hint icons | Poor visual placement of key gameplay aids. |
Decide
Using Metric Trees, the team links early-level completions to retention and in-app purchases. They decide to introduce Power-Up tutorials earlier to help players progress.
Act
They run an Experiment on a new “Use Power-Up” tutorial and measure results. When they see improved completion and monetization metrics, they expand it to all players using Feature Flags.
✨ Result: Level completion improves 35%, and in-app purchases increase 20%, driving sustained engagement.
No matter your industry, the OADA loop helps you turn insights into action-—and Mixpanel gives you the tools to complete that loop faster with every iteration.
Learn More
Want to understand the strategy behind continuous innovation? Check out our blog on How Digital Continuous Innovation Drives Sustainable Enterprise Growth to see how leading enterprises use the OADA framework to connect data, decisions, and action—–and build a culture of sustainable growth.
Was this page useful?